
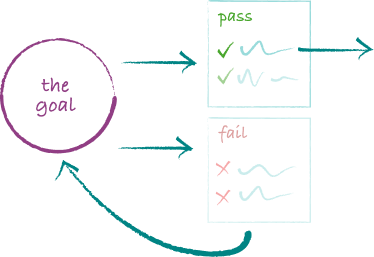
If you’re building on top of something non-deterministic (e.g., it doesn’t always give the same answer to the same question – like an LLM or other probabilistic system), you need something to check that the the outcomes you get are working as expected – otherwise your non-deterministic system could spit out ridiculous responses. You need a mechanism and system to measure, validate and monitor performance. In the AI/ML-world, this is commonly referred to as “evals”. In other words, evals are how we keep ourselves honest — they tell us whether our AI feature is actually doing what we think it is. But designing them is rarely straightforward. Two problems make building evals particularly hard:
1. Defining what accuracy means for your specific use case
2. Creating ground truth data that captures the real-world complexity you'll face in production for your specific use case.
These challenges often get overlooked in the rush to ship. Teams default to automated benchmarks and standard metrics because they're fast and convenient – or they rely on existing datasets rather than considering what’s relevant for the task at hand. This creates a gap between what you're measuring and what actually matters. In the worst cases, you build systems that perform well on benchmarks while failing your users (see Deng et al., 2025 for an example of data contamination in commercial LLMs).
In this post, we’ll first look at why standard benchmarks often mislead teams, then walk through how we approach building evals at Multitudes — from ground truth data to the metrics that actually reflect user experience. Lastly, we’ll share tools that helped us along the way.
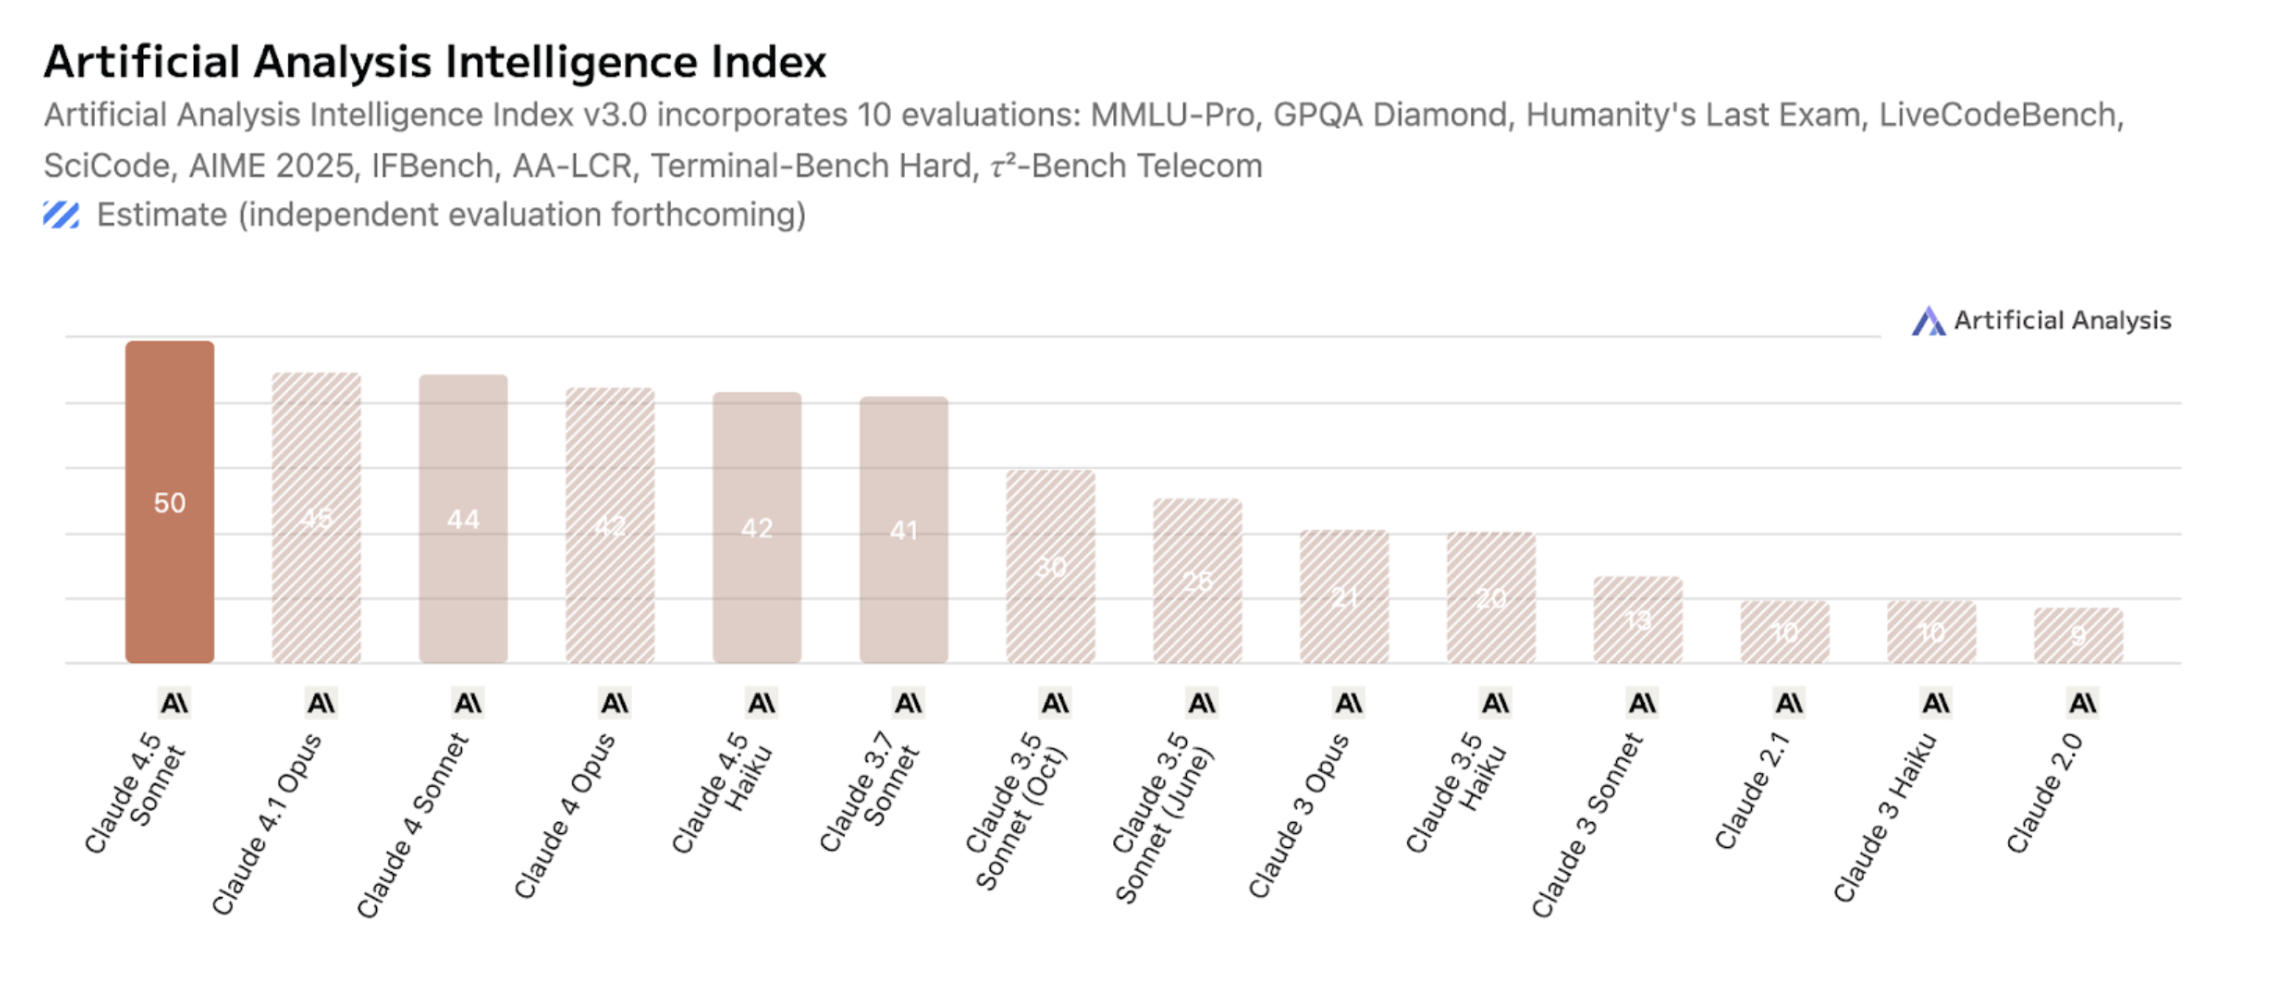
Let’s take Anthropic’s release of Claude Sonnet 4.5 as an example. On paper, it looks like a major leap forward when compared with previous models. It performs well on many of the public AI leaderboards. For instance, Sonnet 4.5 reports 89.1% accuracy on MMMLU, a multilingual benchmark that tests general reasoning across dozens of subjects and languages.
According to Artificial Analysis (a leading provider of LLM benchmarking), Sonnet 4.5 scores almost ~67% higher than Sonnet 3.5 on their composite index, which combines results from ten different public evals.
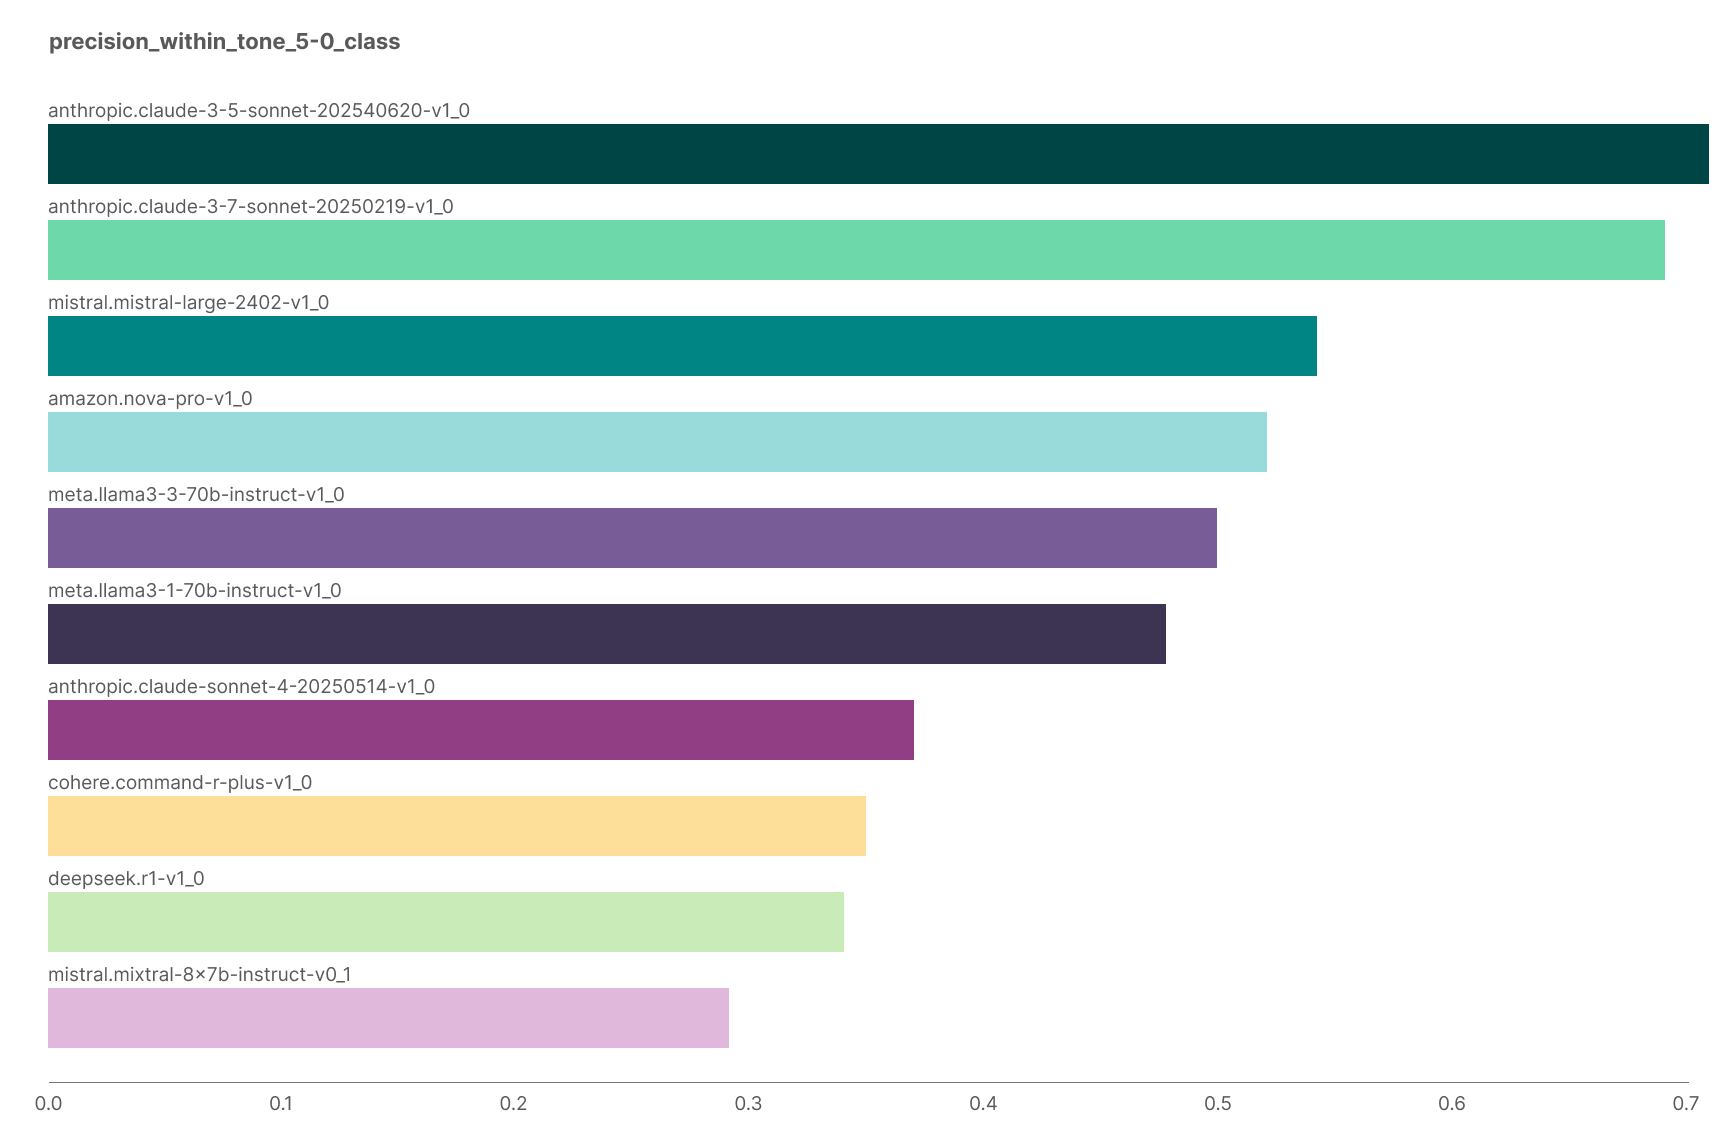
Yet, when we ran these same models on our own data – for our Feedback Quality feature — the pattern reversed. In our evals, Claude Sonnet 4.5 was one of the worst-performing models. One of the metrics we focused on was precision within a specific class: how reliably the model identified “negative” feedback without incorrectly labelling neutral or positive feedback as “negative”. With prompts and model choices fixed to ensure comparability, performance actually from Sonnet 3.5 to Sonnet 4.5.
This gap between leaderboard results and real-world outcomes illustrates a core problem: generic benchmarks don’t tell you whether a model works for your task. They measure general capability, not alignment with your data, context, or definition of success. This pattern isn't unique to our experience. A mathematical result from the 90s—the "no free lunch theorem" (Wolpert et al., 1997) formalized what practitioners like us observe: no algorithm perfectly solves all problems. Performance is always relative to the specific characteristics of your task. Even within model families that are supposedly getting "better," performance doesn't necessarily increase monotonically across all use cases.
Furthermore, a recent survey of 284 benchmarks found that current LLM benchmarks often suffer from inflated performance due to data leakage, culturally biased evaluations, and lack of assessment in dynamic environments (Ni et al., 2025). Models optimizing for these benchmarks may be overfitting to benchmark characteristics rather than developing genuine performance gains.
For product teams, this means stop asking "what is the best model?" Start asking "what characteristics does my problem have, and how do I measure performance on those characteristics?"
In the rest of the blog I share some learnings from our approach on building evals at Multitudes.
So how do you design evals that actually capture what matters for your product? Here’s what we’ve learned from building them at Multitudes.
Evals deserve disproportionate investment relative to other system components because poor evaluation compounds every other engineering decision. Without good evals, you're making decisions in the dark. You tweak a prompt last-minute before launch with no idea if you've broken something critical. You switch to a "better" model (because of generic benchmarks) and actually degrade user experience. You optimize for the wrong metric and move confidently in the wrong direction.
Beyond product quality, there are ethical reasons too. The Gender Shades project exposed IBM, Microsoft, and Face++ shipping facial analysis systems reporting 90%+ accuracy while having error rates up to 34.7% for darker-skinned women (Buolamwini et al.). Their evaluations were fundamentally flawed: They measured overall accuracy without breaking down by race and gender, and they tested on datasets that mirrored training data, which was predominantly white and male, and not reflective of Earth’s population). Once exposed, IBM improved accuracy for darker-skinned women from 65.3% to 96.5% in months. The technology worked fine; the evals were broken. Without proper evaluations, nobody knew what needed fixing.
Robust evals start with two foundations:
Before you can evaluate how well a model performs, you need something to evaluate against. That’s what we mean by ground truth — a dataset that represents the “right answers” according to judgment by domain experts or real-world outcomes. It’s what anchors your evals in reality. But in practice, defining that truth is messy. Human interpretation, domain context, and data ambiguity all get in the way. Teams often have a tendency to use existing labelled datasets when building new features—retro-fitting whatever data they already have to a new problem. This approach gets the process backwards. It's necessary for product teams to first clearly define the goals of what they're trying to achieve with respect to their users, and then determine whether they can leverage existing data or need to define a new ground truth dataset to evaluate against. Designing good evals therefore starts with designing good ground truth.
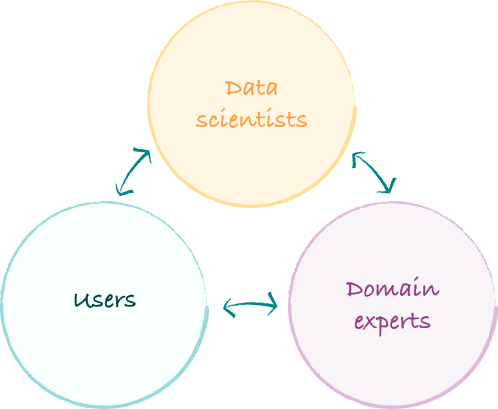
Building ground truth requires three groups to align, and they rarely speak the same language:
Getting alignment takes real time. When building Feedback Quality, we spent hours debating what "negative" feedback actually meant. Does terseness count? What about cultural communication differences? Does context matter—like whether feedback comes from a tech lead versus a junior dev? What about feedback that's technically accurate but delivered harshly? These discussions felt slow and never-ending. BUT without alignment on what we're even trying to detect, labeling a bunch of data is meaningless.
At Multitudes; we learnt that alignment doesn’t happen by accident and needs structure. Here is the process we followed for Feedback Quality:
To statistically measure alignment, calculate inter-rater reliability (IRR) before labelling at scale. If your domain experts can’t agree on the ground truth, your model won’t either.We use IRR statistics early in the process to reveal fuzzy definitions or inconsistent interpretation. Metrics like Cohen’s kappa (for two raters) or Krippendorff’s alpha (for multiple raters and variable data types) measure agreement beyond chance.
Interpreting IRR statistics:
We treat IRR as a diagnostic tool rather than a pass/fail test — it tells us whether the team’s mental models are aligned. Once agreement is solid, then (and only then) does it make sense to label at scale!Agreement is necessary, but not sufficient. Your team might agree perfectly on a dataset that doesn’t reflect the real world at all. The next step is making sure your ground truth mirrors reality.

Fully automated evaluation pipelines sound appealing. Run tests, get numbers, ship if they're green. But this misses something crucial: AI systems serve humans, and humans are messy, contextual, and surprising.
To build evals that reflect reality, your data needs to mirror the people and scenarios your model will actually encounter. Use sampling techniques that represent your user base effectively (for example, stratified sampling). This prevents you from optimising for one segment while neglecting others.
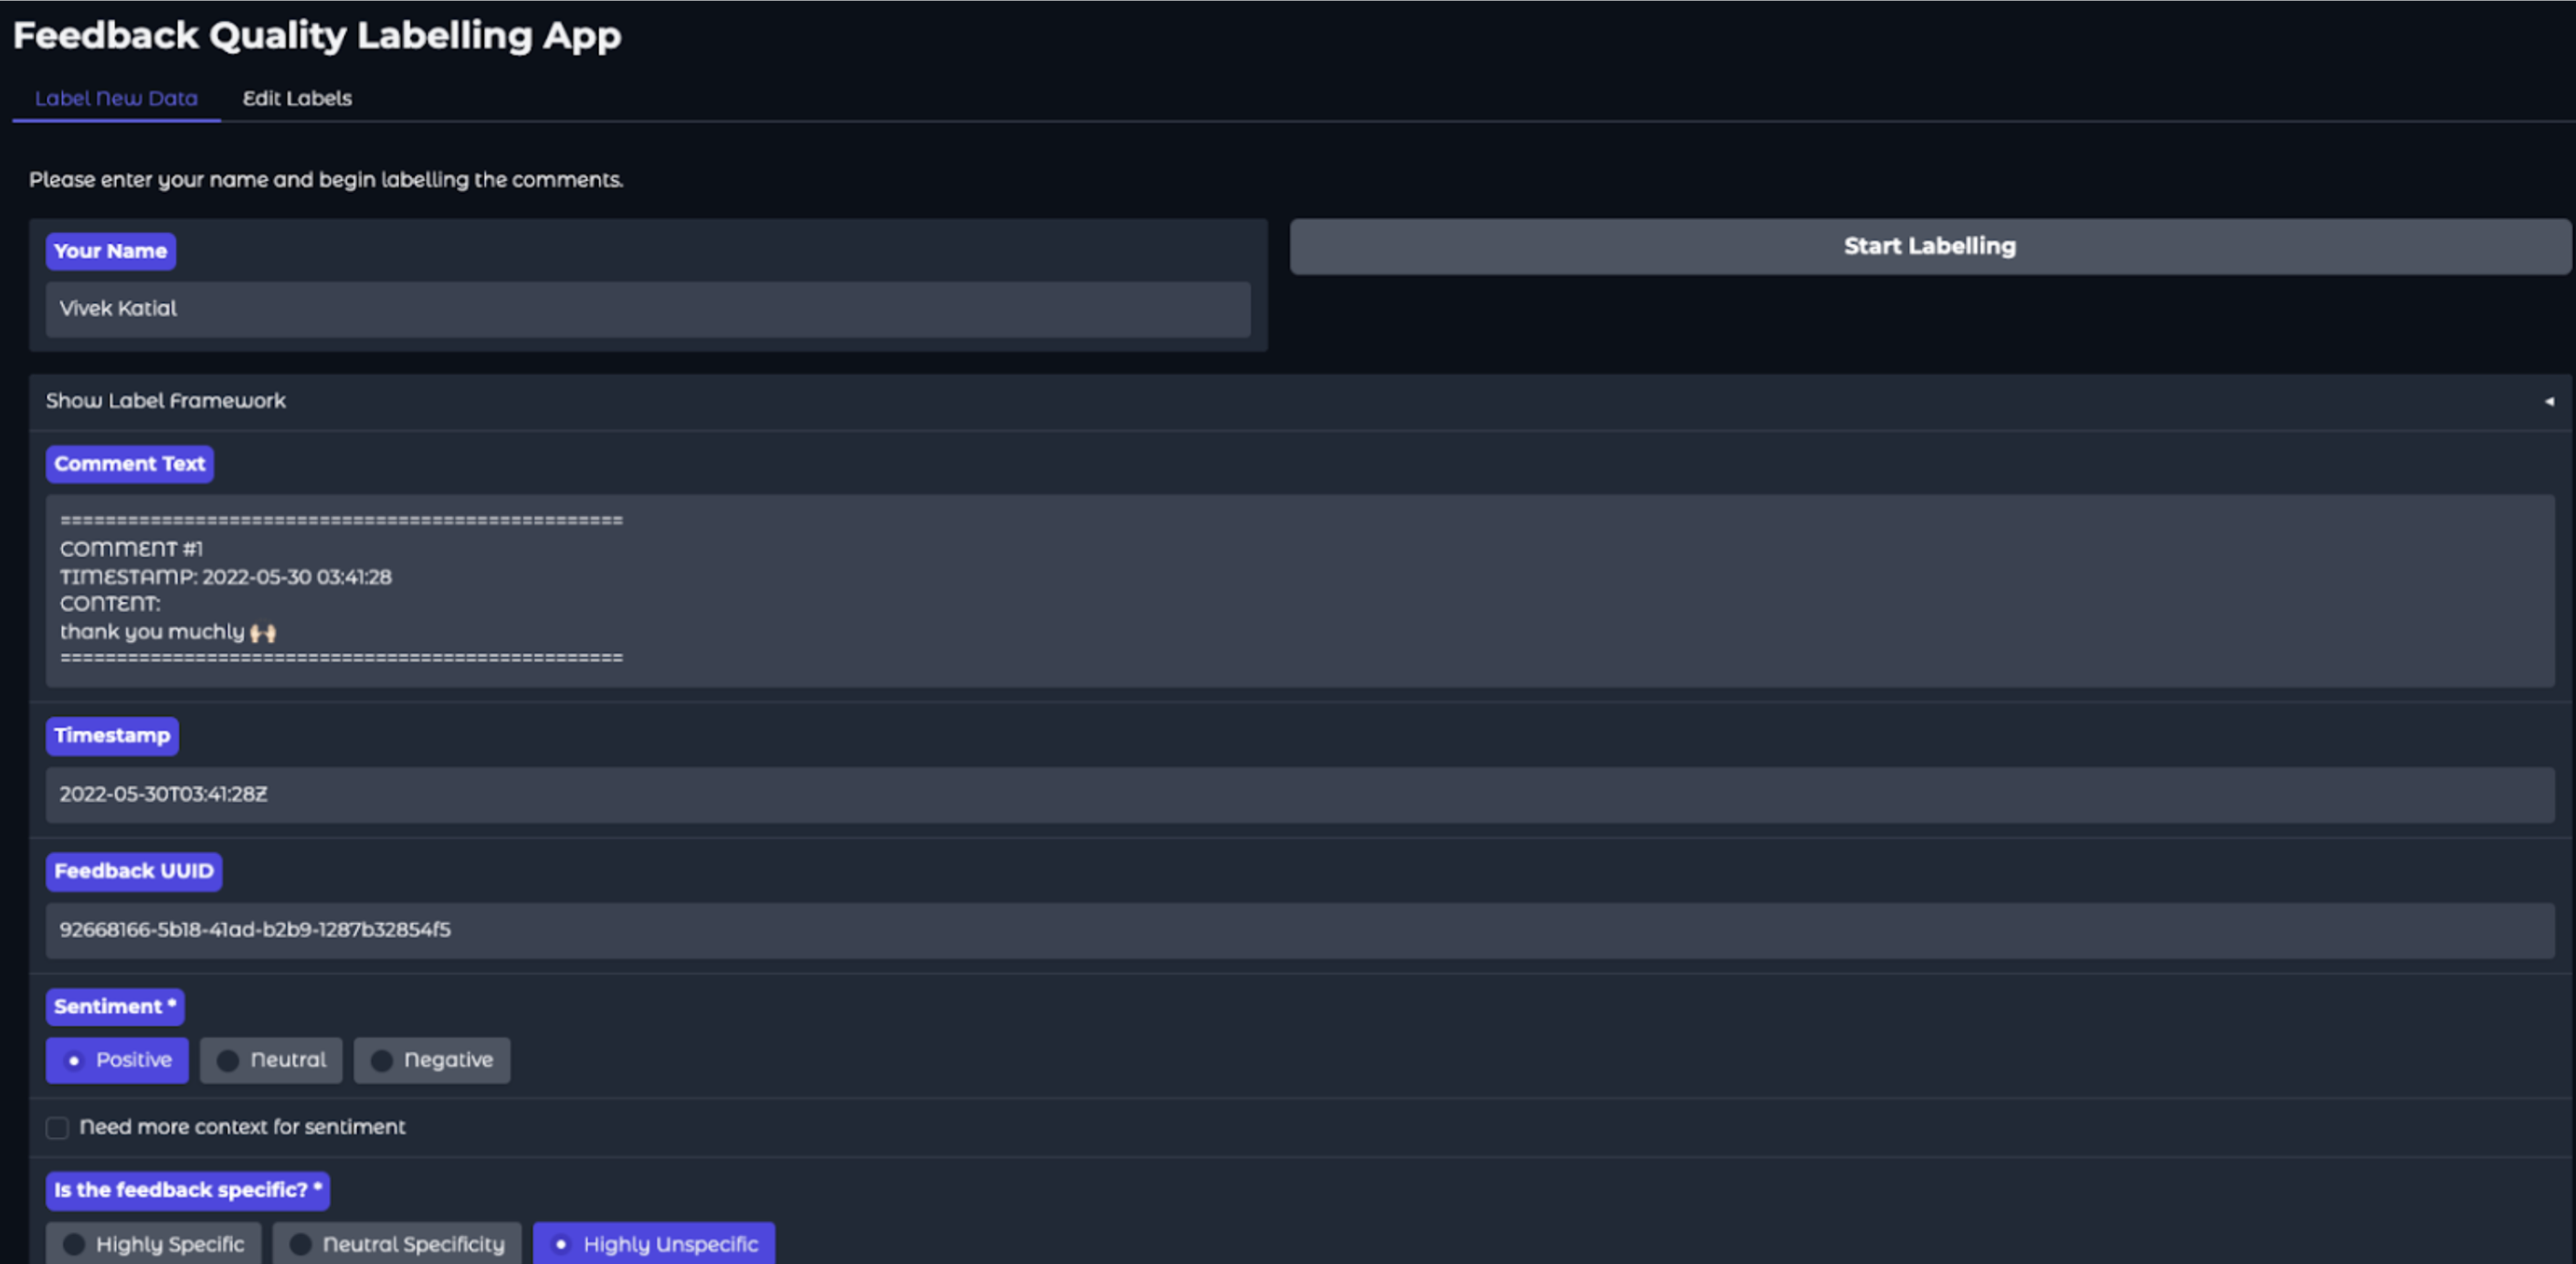
Just as important is reducing bias during labelling. Build tooling that ensures your labelers only see the information available to the model. At Multitudes, we built a Gradio-based labelling app that showed evaluators exactly what context the model had access to — no more, no less (see screenshot).
This prevents bias that arises when humans see extra context and make judgments the model can never reproduce. For instance, if your model only sees the text of a code review comment, but your labelers also see the commit diff, file history, and full conversation thread, they’ll make calls your model can’t learn. Our labelling interface deliberately strips away that extra context, ensuring the ground truth aligns with what the model can realistically infer.
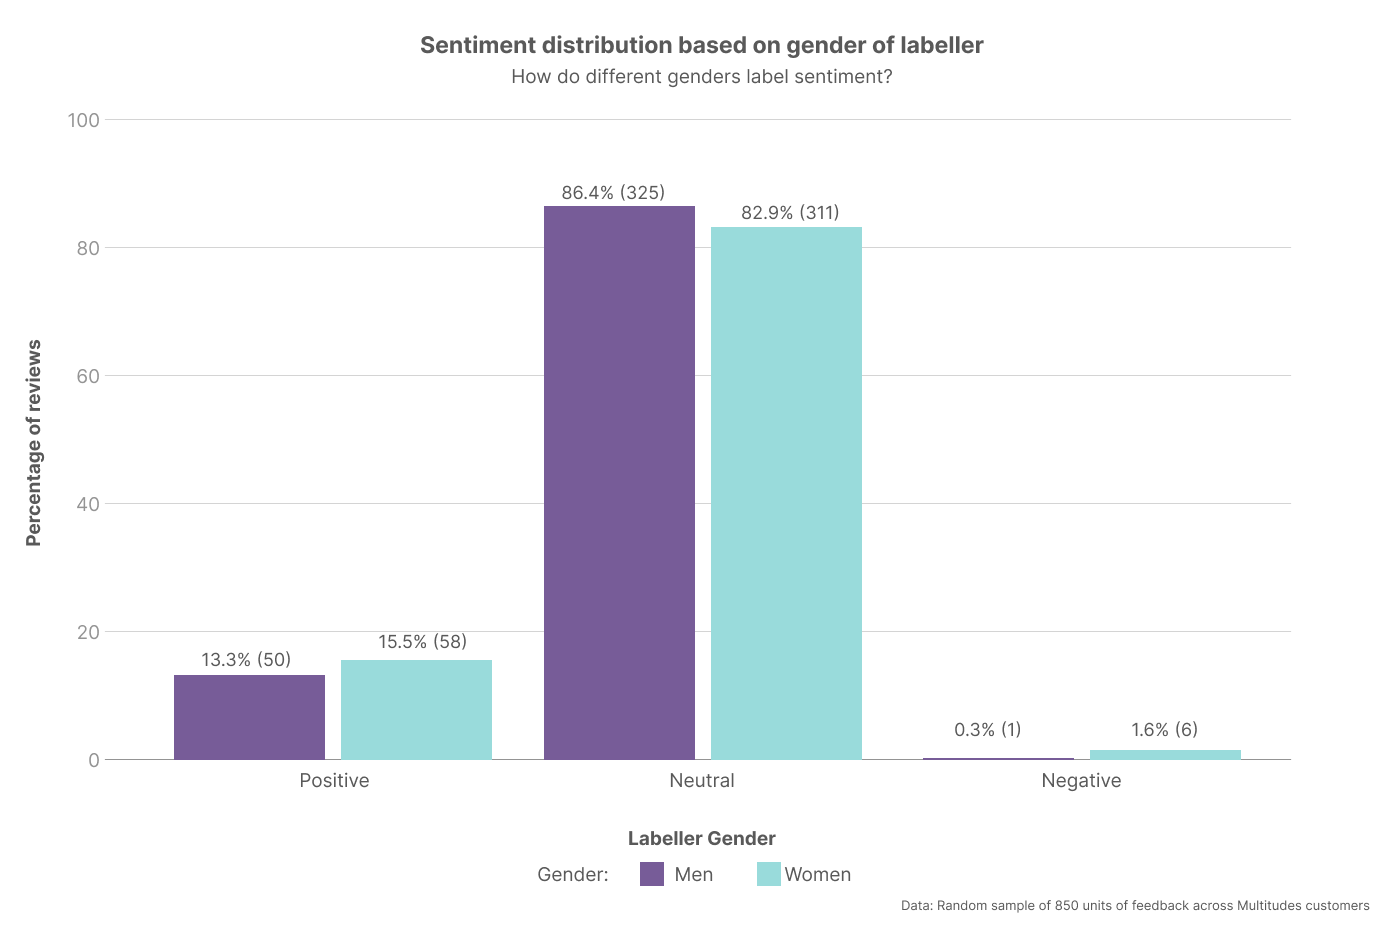
Even within our small labelling team, we saw meaningful differences in how people interpreted sentiment in code review feedback. The chart below shows how men and women in our group labelled the same data: while both leaned heavily neutral, women were more likely to identify feedback as negative. That small gap led to long conversations about what counts as “constructive” versus “destructive” criticism — and reminded us that even when you have alignment on definitions, human judgment isn’t uniform. Plus, people from marginalized groups are often the canaries in the coal mine – and this was true here too. As we saw later, the caution that our women labelers brought to the “negative” bucket was mirrored in our broader user base too.
These are exactly the kinds of subtleties you want to uncover before your model goes live. You may also notice there were only N = 6 samples labelled as negative — which tracks with reality, since genuinely toxic conversations make up a tiny fraction of code reviews. To find more examples of toxic feedback, we later collaborated with Dr Kelly Blincoe on a research project to mine open-source repositories.
Once you have trustworthy ground truth, the next challenge is deciding how to measure success. The right metric depends on what users care about, not what’s easiest to calculate.
The metrics you choose should directly connect to your goals and your problem. This sounds obvious, but we've seen teams default to standard metrics without thinking about what actually matters for their use case.
Here's a real example that illustrates this principle: When building a different feature to identify themes in code reviews at Multitudes (see Feedback Themes)– categorizing discussions about performance issues, testing, security concerns, etc – we discovered that not all classification mistakes have equal impact.
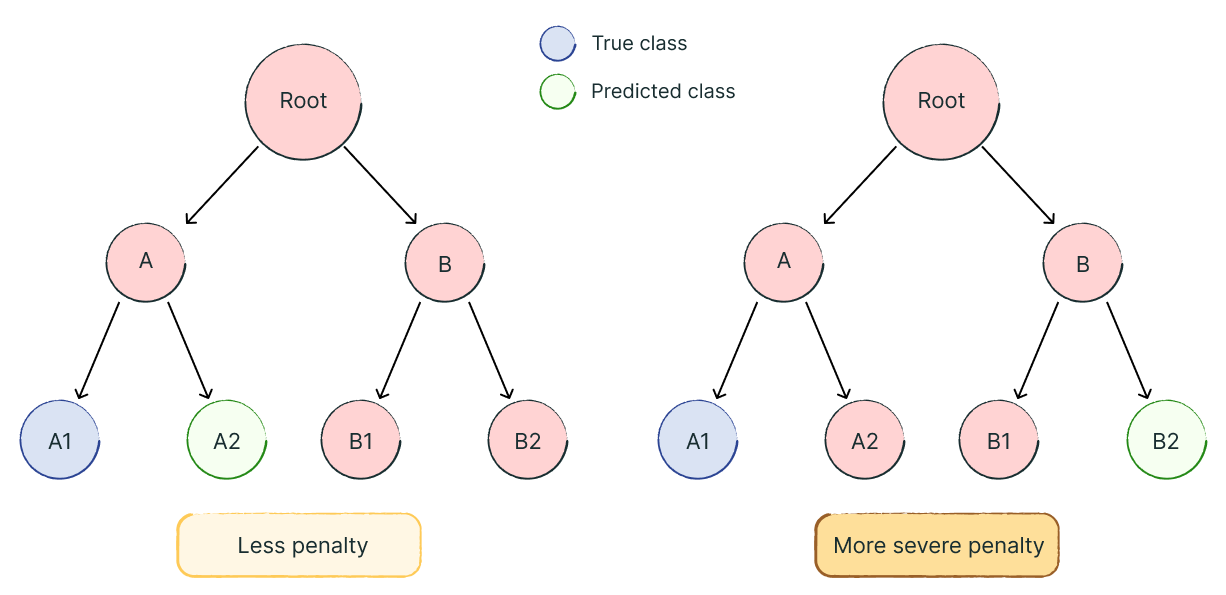
Confusing two subtypes of code quality issues, such as predicting “Code Readability” instead of “Code Formatting,” is much less serious than misclassifying across main categories – like labelling a “Security vulnerability” as a “Communication” issue. To account for this, we implemented evaluation methods that measure how far off a prediction is within our category hierarchy. For example, one measure we optimised for was Wu-Palmer similarity, which quantifies semantic distance between predicted and true labels.
Because our categories are both multi-label and hierarchical, traditional accuracy metrics fail to capture these nuances. A model that confuses “Code Style” with “Code Readability” should be penalised less than one that confuses “Security” with “Communication.” Wu-Palmer similarity solves this by reflecting the semantic relationships between categories and remaining comparable even as the taxonomy evolves.
Some principles for choosing your metrics:
Don't optimize for aggregate metrics alone. Look at performance across different segments of your data. A system with 95% overall accuracy that completely fails for 5% of users might be worse than one with 90% accuracy that works reasonably for everyone. This echoes the importance of intersectional analysis in evaluating algorithmic bias – aggregate metrics can hide serious failures for specific groups.
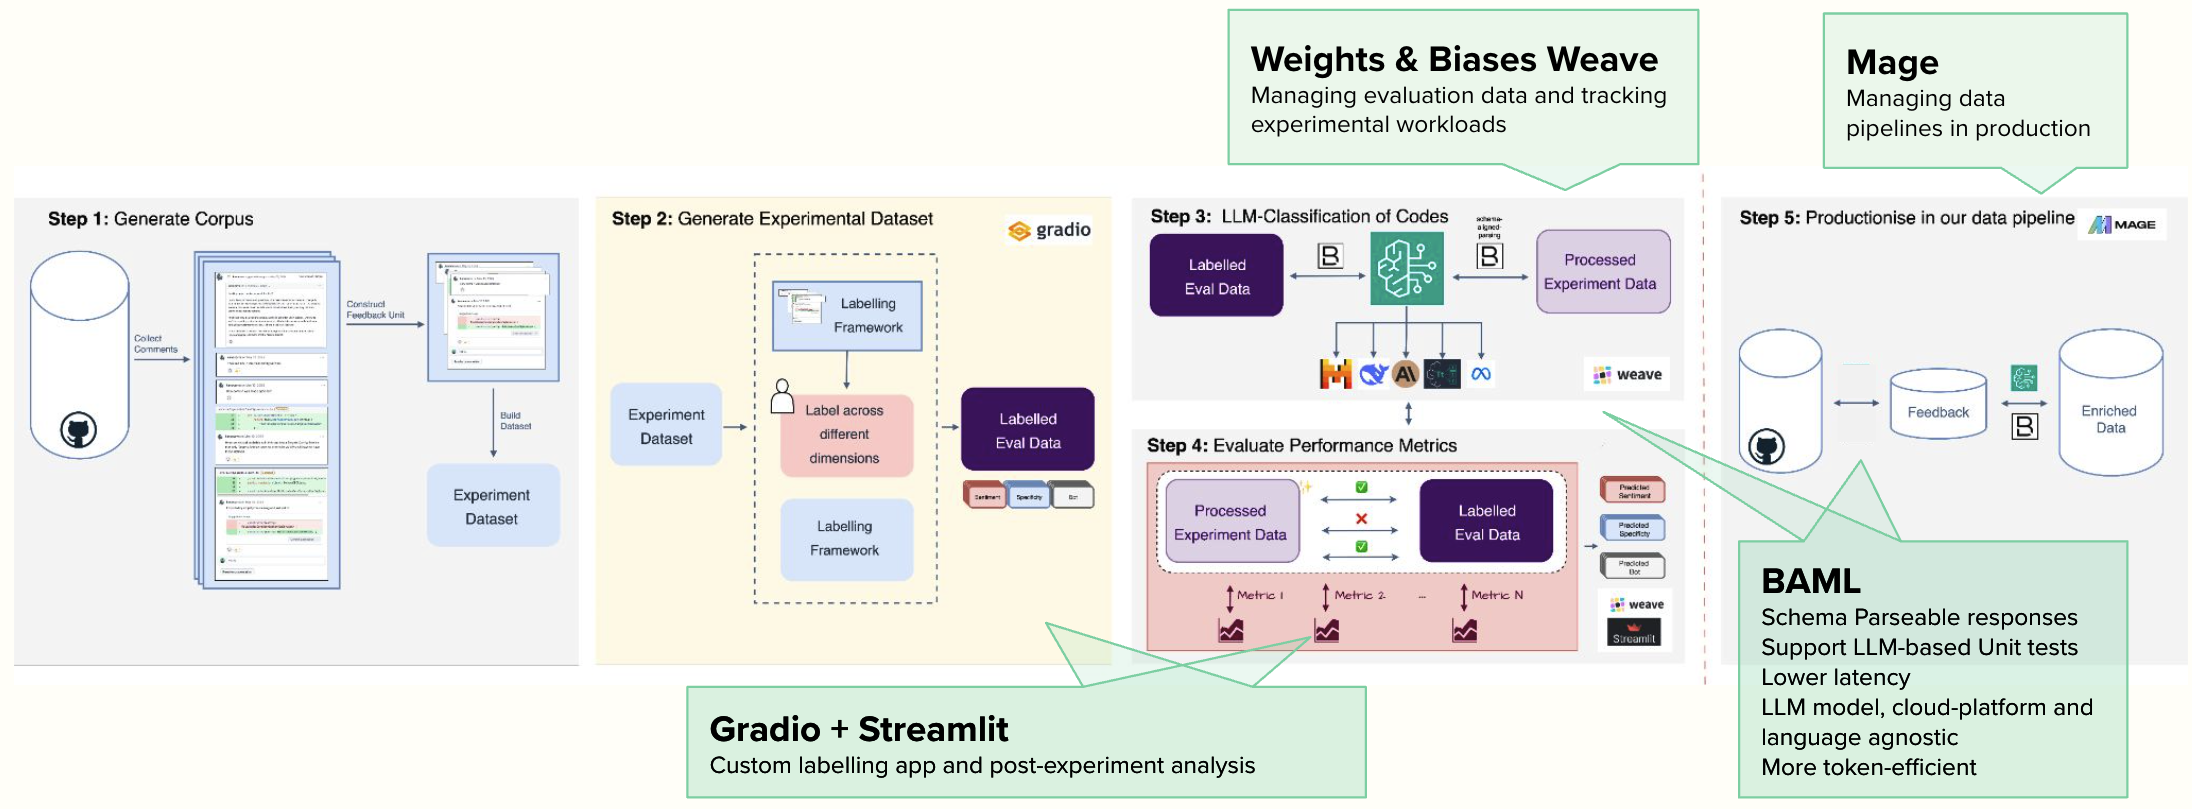
Building evals doesn't mean sacrificing velocity. At Multitudes, we used a toolkit that helped us move faster. Here is what worked for us:
BAML: Schema-parseable responses and LLM-based unit tests
BAML (Boundary ML) gives us strongly-typed, schema-validated responses that work reliably across models and platforms. They also support built-in LLM unit tests. We write test cases that verify prompts produce expected structure and content, catching regressions before production. When experimenting with new prompts for Feedback Quality, BAML tests allow us to quickly prototype ideas before running full experiments. It also meant we could focus on optimizing for our task rather than worrying about parsing LLM responses.
Weights & Biases Weave: Managing evaluation data and tracking experiments
W&B Weave When testing dozens of prompt and model combinations, systematic tracking prevents losing what actually worked.
We use it to version ground truth datasets, track experimental parameters and metrics, visualize performance across segments, and share results with non-technical stakeholders.
Gradio + Streamlit: Custom labelling app and post-experiment analysis
We built our labelling interface with Gradio and did post-experiment analysis in Streamlit. This was easy for us to move quickly because our data team had familiarity with these tools from prior work.
Mage: Productionizing
Mage orchestrates our production workflows: scheduled jobs that conduct all the necessary data transformations and preprocessing, and predictions.
The key takeaway: Leverage existing tools rather than building from scratch. Spend your time designing better evals and understanding model behavior, not reimplementing experiment tracking or building UIs.
Every eval shortcut costs you in production. Every domain expert you skip represents missed edge cases. Every poorly-chosen metric is a future fire. Getting evals right isn't about perfection. It's about honesty. Be honest about what you're trying to achieve, then test rigorously whether you're achieving it.
Remember AI systems serve humans—messy, contextual, surprising humans who need to be part of the evaluation process.
We also saw that though LLMs keep getting better on benchmarks, that's largely irrelevant to whether they'll work for your feature. No Free Lunch theorem and Instance Space Analysis make this clear: performance depends on your specific problem characteristics, not someone else's benchmark suite.
If you’re building your own eval system, start small but deliberate. These are the steps we’ve found most useful.
Because at the end of the day, the question isn't whether your model achieved 99% accuracy on a benchmark. It's whether it's making your users' lives better. Good evals help you answer the question that actually matters.
---
For more on bias mitigation and equitable data collection, see our post on data ethics and algorithmic bias. For more on evals for PMs check Hamel Husain's "Your AI Product Needs Evals".


Get useful insights on team performance and culture, along with updates on our product!
© Copyright 2026 Multitudes Limited. All rights reserved.

.svg)
.svg)
.svg)