
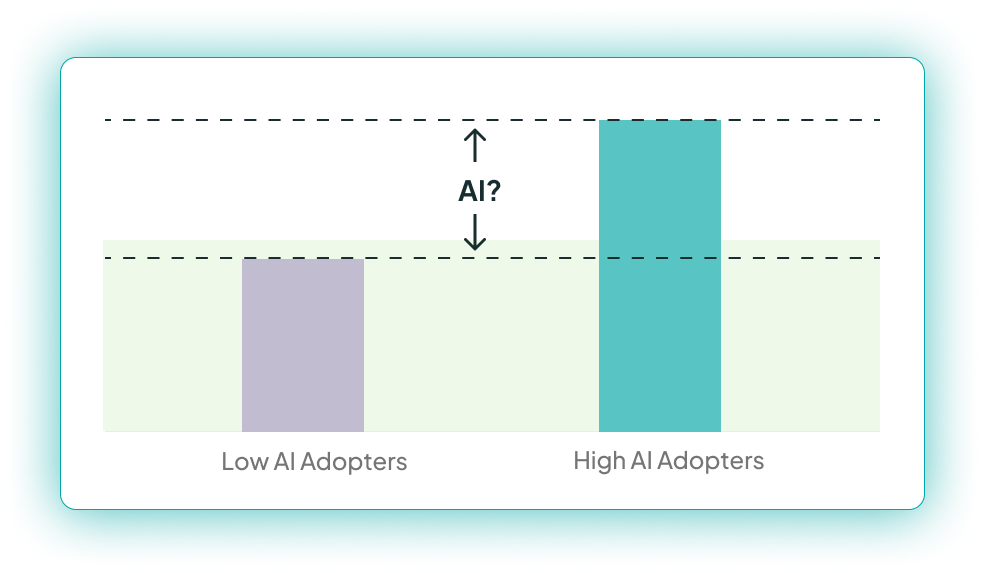
Everyone wants to know the impact of AI on developer productivity. What too many do is to compare metrics for high AI vs low AI users, then say the difference comes from AI – but this is misleading.
Our research has surfaced real-world examples where this approach gets it wrong. The core reason is because the people who choose to use AI more are different from people who choose to use AI less. If we could design a controlled experiment where we randomly assign someone to use AI or not, then we could argue that these groups are the same – but that's very much not the case here.
Let's spend a moment on that: What are some reasons that a dev might use AI more than another dev? Maybe they're hyper-focused on their own productivity, so they're always looking for new ways to become more productive. Maybe they’re doing work in a language that AI performs better on. Maybe they’re newer to the codebase they’re working on so they want AI to help them get up to speed. Maybe they’re really excited by new technologies in general.
Now: Do any of these factors impact how many PRs someone is merging? Or how fast they move from first commit to deployment? Or how often they have a failure when they release a change?
You bet.
And that’s the problem with comparing high AI users and low AI users – there are ALL sorts of reasons why people using lots of AI might be different from people using less AI.
These reasons mean that the people in the high and low AI usage groups likelySTARTED OUT with different metrics, even before AI was ever introduced – there’s a selection bias in who chose to use AI more. That selection bias means that we have confounding factors that mean that the presence of AI is not the only thing impacting the outcome metrics we see.
Examining how those groups differ is interesting, but you can’t conclude that their differences are because of AI.
Follow along below as I share real-world examples from times when comparing low vs high AI adopters was completely wrong.
One risk of AI is that it degrades the code quality. Now, we want to know if AI has caused a bug before we have our first AI incident – so we're looking for early indicators of the impact of AI on code quality.
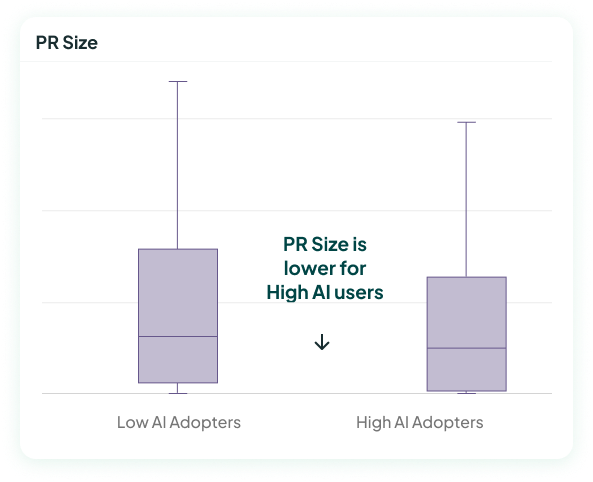
One great early indicator is PR size. Years of research show that long PRs allow more defects through and take longer to review. Given that LLMs are verbose, we expect AI usage to lead to longer PRs.
The image below seems to show just that. It shows the median PR size for the low AI adopters to the same metric for the high AI adopters – and the high AI adopters have a smaller median. So more AI usage causes smaller PRs, right?
The story changes when we look at PR sizes before AI was introduced. We see that high AI users started out very different from the low AI users: They actually started out with a significantly smaller PRs size. Then, after they started using AI, their PR size increased relative to where they'd started.
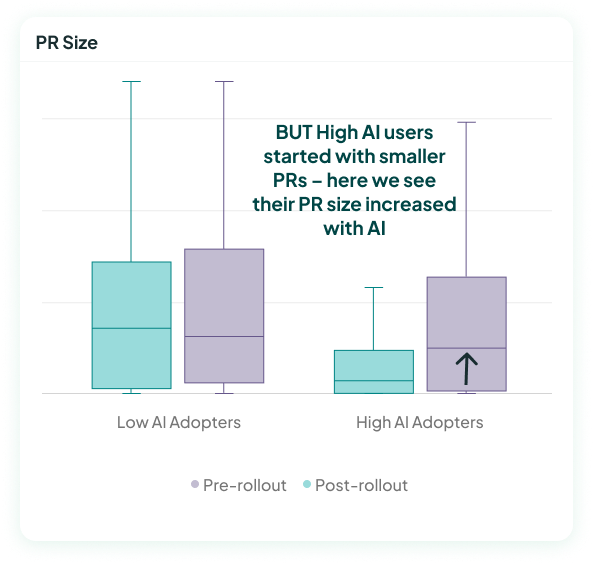
The selection bias of who uses AI meant that our high AI adopters started out very different from low AI adopters.
In this case, the simple low vs high AI use comparison would make us think that AI decreased PR sizes – which is the reverse of the truth, which is that people using AI more saw their PR sizes increase.
AI writes code quickly – does that mean it speeds up the total time it takes to deliver a change?
A good metric for this is looking at Change Lead Time (CLT), which measures the time from the first commit on a PR to when that PR is deployed in prod.
I've pulled real-world data from another company as an example for this. The chart below shows the median CLT for high AI adopters compared to low AI adopters. It seems to say that CLT got worse with AI – because the high AI adopters have a higher median than the low AI adopters.
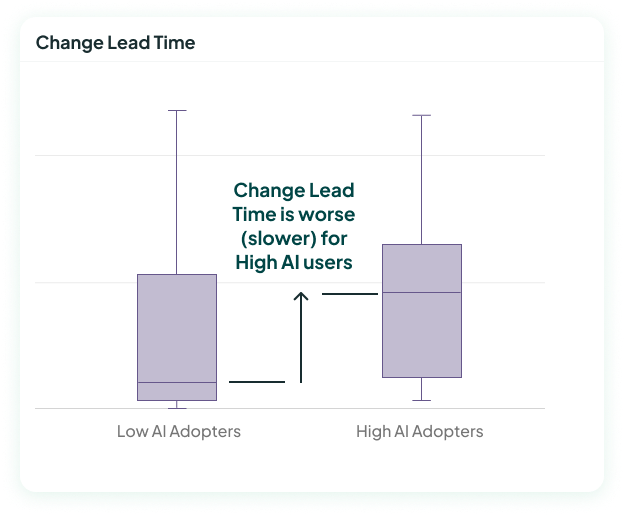
BUT when we control for initial differences (below), we see that the high AI usage group actually started with a much slower change lead time than the low AI adopters. Compared to their own state before, the high AI adopters actually got faster with AI.
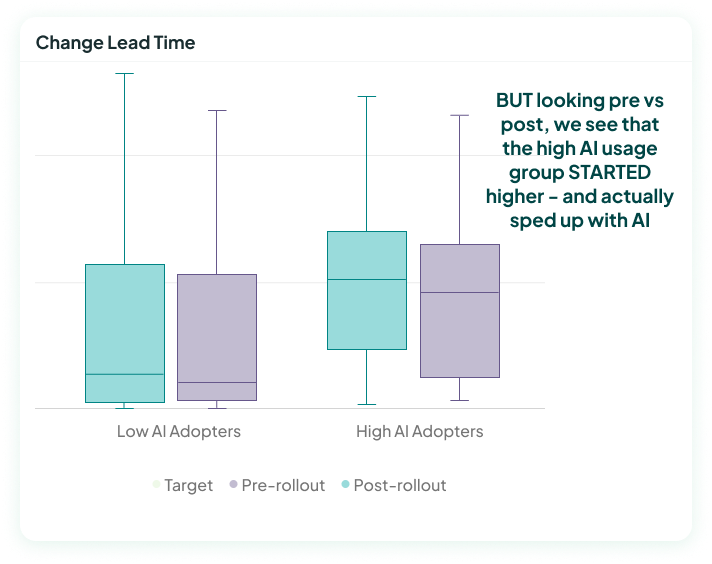
In this case, controlling for initial differences shows that AI had a positive impact, helping the people using AI to move faster.
The differences between high and low AI usage groups could come from pre-existing differences, an omitted variable, or AI itself.
Of course, you might not have the "pre" data to compare to. If the only data you have is a comparison across high vs. low AI usage groups, then of course use what you have – because that's better than nothing. Just don’t claim that the differences come from AI. Instead:
You don't need to make your teams run a randomized controlled trial – there are easier actions we can take to help us better understand the impact of AI even with the data we have.


Get useful insights on team performance and culture, along with updates on our product!
© Copyright 2026 Multitudes Limited. All rights reserved.

.svg)
.svg)
.svg)