
You’re likely here because someone’s asked you: What’s the return on investment (ROI) of our AI tooling?
Below, we’ll share some quick principles and an ROI calculator. If you want a deeper-dive into how to calculate ROI for AI tooling, check out this blog post.
Intro to ROI
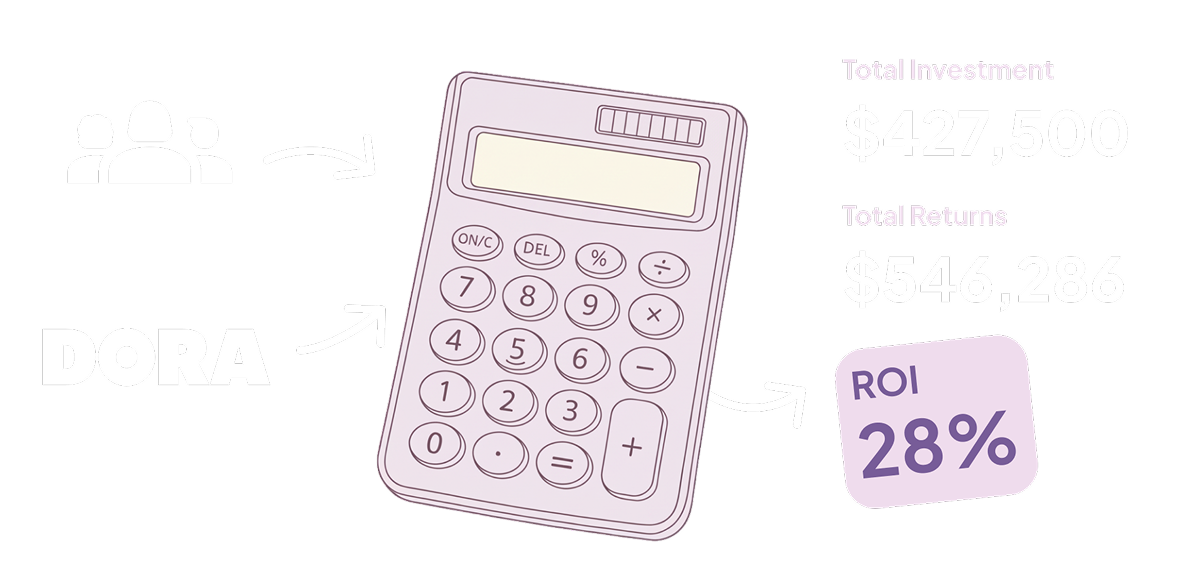
ROI means return on investment. It shows how much benefit you got from an initiative over and above the costs. Here’s the formula:
3 key principles for measuring ROI
These principles come from common mistakes we’ve seen when people build ROI models. These principles are also baked into our ROI calculator below.
1. Your outputs are only as good as your assumptions So be clear about what your assumptions are. Below, we’ve got the inputs and assumptions to the left – so you can see and update them as needed.
2. The investment should include money AND time costs You’ll see that we include both the cost of AI tooling and the time cost of people supporting AI usage in your organization. You might also want to include other costs like learning time, though we’ve excluded that here because it can vary so much by individual and can be hard to separate from working time.
3. The returns should come from the investment. In this case, that means the returns we measure should come from AI tooling.We need to try to separate the impact of AI from the impact of all the other things that were changing in our organization at the same time.
To measure returns, we also need to be clear on what returns we’re wanting from our AI investment. We suggest that the change in customer value (more value delivered to customers, with fewer customer issues) is the key one to focus on here – since that’s what links engineering work to positive outcomes for the business.
For more about how to calculate ROI and specifically how to calculate it for your AI tooling, check out this blog post: A guide: What’s the ROI of AI tooling?
Data decisions to make before using this calculator
What metrics of customer value do you have available?
The model below assumes you’ll use DORA metrics, since that’s the most-widespread set of engineering metrics so you’re most likely to have it on hand – and because they’re linked to customer value.
We also share alternative metrics you could substitute in from your issue tracking data – and you’re welcome to do other substitutions as long as you keep the units the same.
Do you know how many high AI adopters you have?
In order to understand what the impact was from AI tooling, we need to know who’s been using it regularly.
Based on our AI impact research, we define this as people with a weekday DAU >50% – our research showed that this usage level was meaningful enough to shift outcomes. If you’re looking at a DAU of the whole week, then we recommend looking for people with > 35% – if weekend usage was 0, then 100% weekday usage = 5/7 = 71%. Half of that is ~35%. More here about how we calculate High AI adopters.
If you don’t have this on hand, you can start by using an estimate and come back later to update it.
Can you get metrics from before vs after the AI intervention?
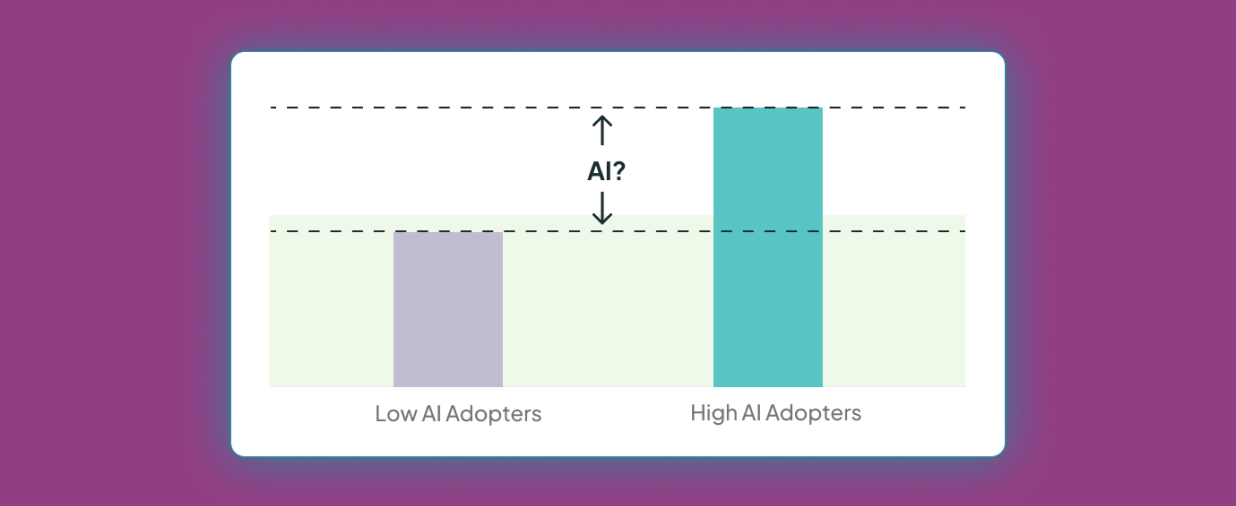
Simply comparing the metrics for low vs high AI adopters can be misleading, because those groups likely didn’t start out with the same metrics before they started using AI.
For this reason, it’s best if you can get metrics from before vs. after the AI rollout – and ideally you have these for your high AI adopters, because these are the people where we expect AI to have had a meaningful impact.
If you have pre vs post metrics for all developers, not just for your high AI adopters, then you can use those instead of focusing on high AI adopter metrics.
If you don’t have any pre vs post data, then we’ve given the option to compare low vs high AI adopters. We’ve included this so that you can get some indication of ROI from your existing metrics, but this is not an approach we recommend – because it’s likely capturing other factors beyond AI. We’ve written more about how not controlling for initial group differences can lead to wrong conclusions.


.svg)
.svg)
.svg)